Matplotlib: Data Visualisation on Fingertips
Introduction
Data visualization is an integral part of data analysis, and when it comes to Python, Matplotlib stands out as one of the most powerful and versatile libraries for creating stunning visualizations. Whether you're new to Matplotlib or an experienced data analyst looking to level up your visualization skills, this blog will take you on a journey from beginner to advanced. Before going to the main part of the Matplotlib, let's look about it history.
What is Matplotlib?
Matplotlib is a Python library that provides a vast variety of tools for creating high-quality static, animated, or interactive visualizations. It was created in 2003 by John D. Hunter and has since become a cornerstone of the Python data science ecosystem.It is particularly well-suited for generating various types of graphs, plots, charts, and other visual representations of data. Matplotlib provides a comprehensive set of tools for creating high-quality 2D and limited 3D plots and is widely employed in data analysis, scientific research, and other fields where data visualization is crucial.
Matplotlib offers a wide range of customization options, making it possible to fine-tune the appearance of plots, labels, legends, and other elements to suit specific data visualization needs. This library has been instrumental in enabling data analysts, scientists, and researchers to effectively communicate their findings and insights by presenting data in a visually compelling and informative manner.
Why Matplotlib?
Have you ever thought why data analysts and data scientists in python community likes to use matplotlib. Let's get the answer of this question. There are many reasons behind its acceptance but let's look some of them.
- Versatility: Matplotlib is incredibly versatile and can be used to create a wide range of static, animated, or interactive plots and visualizations. Whether you need simple line plots, bar charts, scatter plots, complex 3D visualizations, or even custom plots, Matplotlib can do all of it.
- Customization: Matplotlib offers extensive customization options. You have the control every aspect of your plots, be it as simple as colors, line styles, markers, fonts, labels, or legends, you can control them and even more. This flexibility allows you to create visually appealing and informative charts tailored to your specific needs.
- Integration: Matplotlib integrates seamlessly with other popular Python libraries used in data analysis and scientific computing, such as NumPy, Pandas, and SciPy. This makes it a valuable tool for creating visualizations from your data structures.
- Open Source: Matplotlib is open-source and free to use. This means that anyone can access and modify the library's source code. The open-source nature of Matplotlib has led to a vibrant community of contributors and an extensive ecosystem of extensions and plugins.
- Wide Adoption: Matplotlib has been an intergral part of the Python data science and scientific research landscape for nearly two decades. It is well-established and trusted by a large community of users and researchers. As a result, you can find a wealth of tutorials, documentation, and online resources to help you learn and use Matplotlib effectively.
- Cross-Platform: Matplotlib is cross-platform, meaning it runs on various operating systems, including Windows, macOS, and Linux. This ensures that your plots can be created and displayed consistently, regardless of your operating environment.
- Education: Matplotlib is commonly used in educational settings for teaching data visualization and introductory data analysis due to its simplicity and availability.
- Extensibility: Matplotlib can be extended and customized using additional toolkits and libraries. For example, you can create geographic maps with Basemap, produce interactive visualizations with mpl_toolkits, or integrate with specialized visualization libraries like Seaborn.
- Publication Quality: Matplotlib is capable of producing publication-quality plots and figures suitable for inclusion in research papers, articles, and presentations.
Getting Started
The first step for using matplotlib is to install in your system and like all other libraries in python we can install it using pip or conda.
1# Using pip
2pip install matplotlib
3
4# Using conda
5conda install -c conda-forge matplotlib
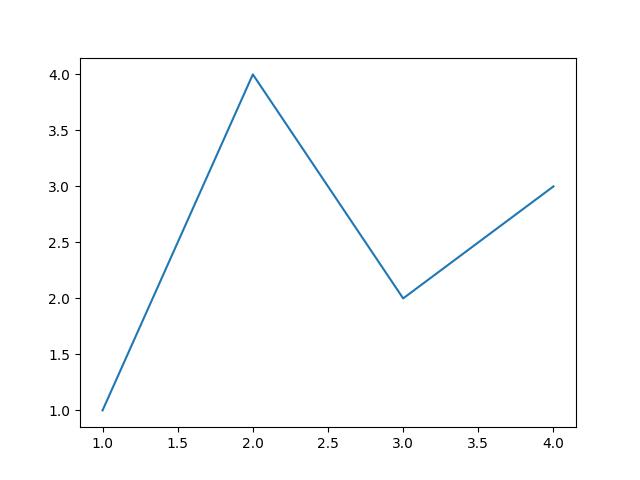
Let's have a quick example on using matplotlib
1import matplotlib.pyplot as plt
2
3x = [1, 2, 3, 4]
4y = [1, 4, 2, 3]
5
6plt.plot(x, y)
But what is this pyplot in the import statement. import matplotlib.pyplot as plt. This pyplot is a sub-module within the Matplotlib library that provides a high-level interface for creating and customizing various types of plots and charts. It is designed to make it easier for users to generate plots quickly with a minimal amount of code. pyplot is often used in conjunction with the main Matplotlib library to create static, animated, or interactive visualizations.
Conclusion
In this part of Matplotlib series we have learnt What is matplotlib, Why do data analyst and data science community prefer it so much and How can we use it? Let's take a break. In next part we will dive deep into more details and also see different types of plots we can do with the help of matplotlib.
Thanks & Stay tuned for the part II.